
Free Stock Charts
Create free stock charts for leading global stocks.
Get BATS real-time prices with up to 10-years of chart data.
Zignals HTML5 charts can be used on all the latest browsers and OS systems.
Frequently Asked Questions
- I can't find my stock/ETF or ETN?
- When will you cover Options, Mutual Funds, Bonds, Futures or non-energy/precious metal commodities?
- Can I post a chart to Twitter?
- How do I get access to Forex, ETF or other exchange data?
- How do I keep a chart theme/setting/format?
- How do I change the colour of a Zignals Stock Charts?
- Can I change the charts to a white background?
- How do I delete an annotation on Zignals Stock Chart?
- How is Support and Resistance calculated?
- How do I set Fast and Slow stochastic values?
- How do I save a Zignals Stock Chart
- How do I report incorrect price data on a chart?
- I can't find my stock/ETF or ETN? Back to Top
-
If the stock or ETF is listed in one of the exchanges we cover please send us a request and we will look to add the missing asset if available to us. We don't currently have ETNs available to us, but we are looking at a provider of the data.
All members, premium or free, can chart available assets. Members at the free level can create alerts from one of the default stocks in the preset watchlists. Premium members can create alerts on any asset.
- When will you cover Options, Mutual Funds, Bonds, Futures or non-energy/precious metal commodities? Back to Top
-
We plan to add exchanges and assets based on demand for them, and the markets we wish to expand into. If there is a market you would like to see covered send us a request for it.
- Can I post a chart to Twitter? Back to Top
-
You can save a chart to your hard drive and post this to Twitter. We will look to add Twitter posting To get to this address the viewed chart has to be loaded in the charting application (you will see the navigation change); in the browser address bar is the unique address for the chart. The URL can also be found when you open or save a chart. Copy and paste the chart URL into a service like tinyurl.com or bit.ly to shrink it down and then use this in a twitter post. A bit.ly link is generated as part of the Chart Save function.
- How do I get access to Forex, ETF or other exchange data? Back to Top
-
Send us an email (mailto:[email protected]) and we will endeavour to do what we can. Adding stocks to our database is a Premium level feature. You can upgrade your account to take advantage of this. But email us first to ensure we have what you are looking for.
- How do I keep a chart theme/setting/format? Back to Top
-
If you have a favourite chart setting of indicators and price overlays you want to use, create a Template, available in the chart menu. You are not limited to a single template. Templates can be created for intraday, end-of-day or for particular alert specific conditions.
- How do I change the colour of a Zignals Stock Charts? Back to Top
-
Right click inside the chart to open the Settings menu. You can change background colours and colours of the price bars. When you save a Template, these colours will be saved too.
- Can I change the charts to a white background? Back to Top
-
Yes, right-click within the chart and open settings. The background colour of the chart (along with other elements) is available there.
- How do I delete an annotation on Zignals Stock Chart? Back to Top
-
All indicators, price overlays, text boxes and highlight regions can be deleted and edited using a right-click on-hover-over of the shape or draw item. Within the Draw menu is also a [Remove All] button, which removes all added draw items.
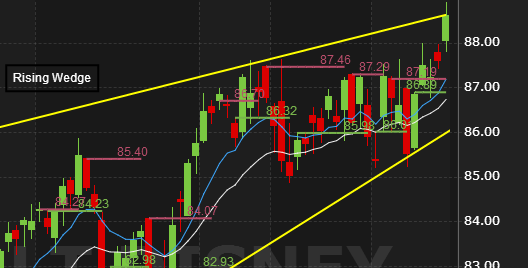
- How is Support and Resistance calculated? Back to Top
-
The Support and Resistance indicator is based on swing highs/lows. Support/Resistance levels are updated as old levels are taken out. Support/Resistance ignores price extremes, and instead focuses on price areas seeing heaviest action.
- How do I set Fast and Slow stochastic values? Back to Top
-
To set a Fast stochastic of 14 days with a 3-day moving average enter for [%K Period] a value of 14, [%K slowing] a value of 1, and a [%D Periods] value of 3.
To set a Slow stochastic of 14 days with a 3-day moving average enter for [%K Period] a value of 14, [%K slowing] a value of 3, and a [%D Periods] value of 3.
- How do I save a Zignals Stock Chart? Back to Top
-
Charts are saved to the hard drive as a JPG file. To do this, click the Save icon. This brings up a snapshot of your chart. Then right-click in the snapshot to bring up the browser menu with the 'Save as...' option. Saved charts can then be tweeted.
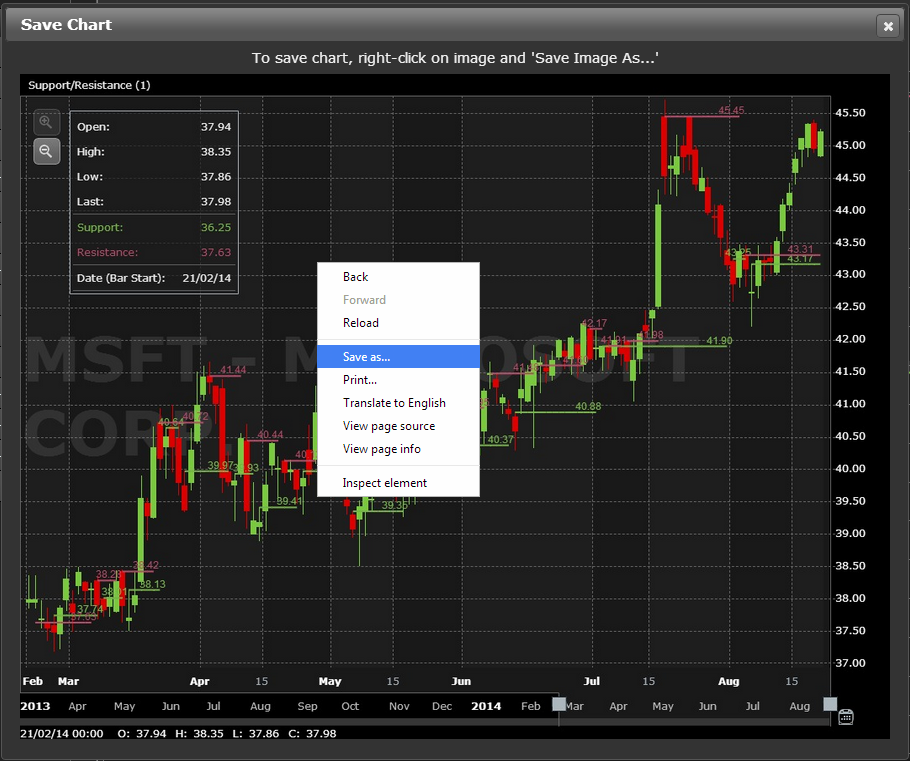
Chart Image Save
- How do I report incorrect price data on a chart? Back to Top
-
Send us an email at [email protected] if you believe our data is incorrect. Charts use BATS live pricing and historic data from IDC.