
Free Stock Charts
Create free stock charts for leading global stocks.
Get BATS real-time prices with up to 10-years of chart data.
Zignals HTML5 charts can be used on all the latest browsers and OS systems.
How do Stock and Forex Charts Work?
Take your charting to the next level. Zignals free stock and forex charts now come with in-built alerting. Use Zignals indicators, Fibonacci overlays and/or support/resistance to define key price points for alerts. Access the stocks or forex currency pairs you need from the sidebar watchlist, or directly from the search box.
-
Stocks in the free stock charts application can be accessed from the sidebar watchlist, or directly from the search box.
-
Region Zoom
Select the magnifying glass icon to activate region zoom. Click and drag left or right, the area of the chart you wish to focus on. Upon release, the chart will zoom into this area. Click the reset icon, located beneath the +/- zoom levels in the top-left corner of the chart, to return the stock or forex chart to the default view.
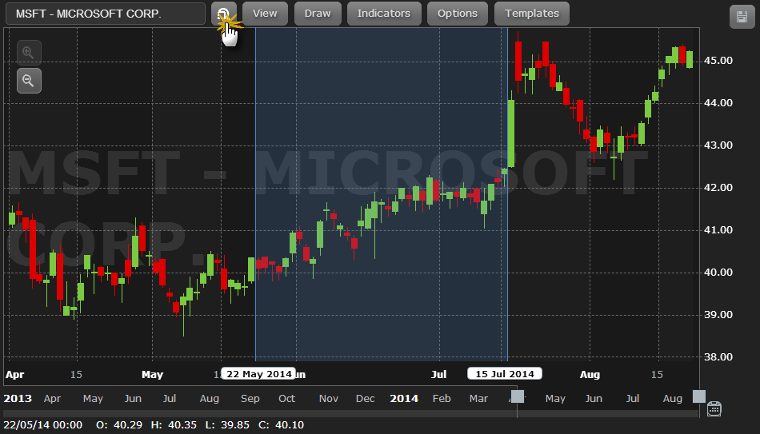
Zignals free stock charts support region zoom
-
Time interval / time frame view
Stock and Forex charts can be viewed at time intervals from 1-minute up to monthly. When a time interval is selected it will default to the shortest time frame, but clicking a timeframe will load a chart at a longer time frame
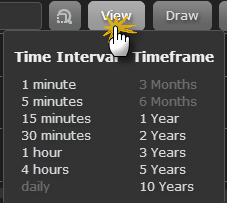
Zignals free stock and forex charts
support real-time intraday data
-
Time Interval Zoom
The +/- magnifying glass zoom in the top-left of the stock chart allows for cycling through time frames for a selected time interval. For example, clicking on the +/- magnifying zoom for a 1-minute chart will cycle through 2 hour, 4 hour, 1 day and 3 day charts.
-
Draw
Draw items are classified into three categories: Basic, Shapes and Text, and Advanced. Prior to adding a draw item, the Shape properties can be set. These properties can also be changed after a shape is added. Draw items are classified into three categories: Basic, Shapes and Text, and Advanced. Prior to adding a draw item, the Shape properties can be set. These properties can also be changed after a shape is added.
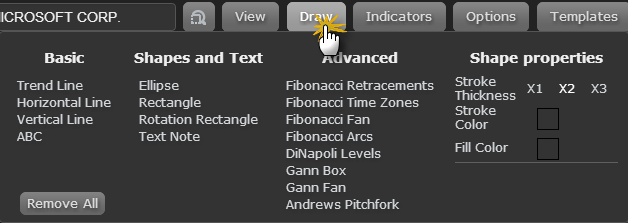
Zignals free stock charts offer a range of draw functions
-
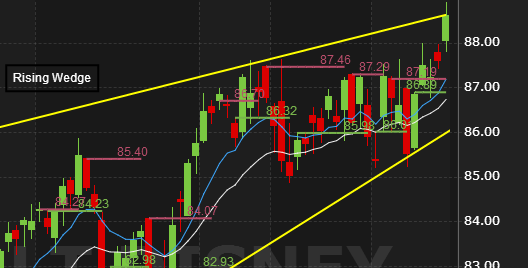
Trend Line
This line is anchored by two points on a chart. To create a price channel, select-and-right-click the line on the chart and do a line copy. Then, select an area of the chart, right-click-and-select paste.
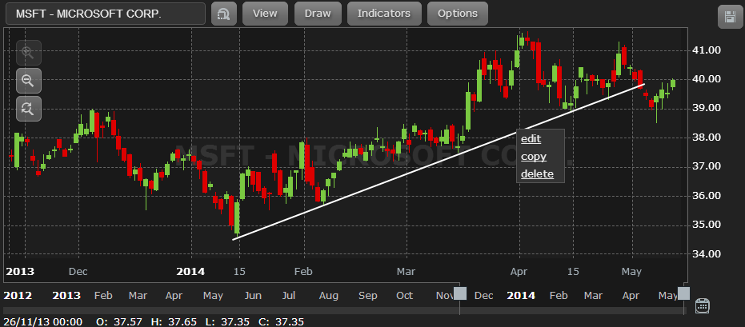
Copy and paste a line to create a price channel on a Zignals free stock chart
-
Horizontal Line
This is price line marker, best used to denote custom support and resistance. When a Horizontal Line is applied it automatically extends to the price axis and displays the price.
To configure the line, right-click edit. A line can be edited for different thickness or colour, opacity, type and if the line should extend beyond the anchors to the future (default) or past.
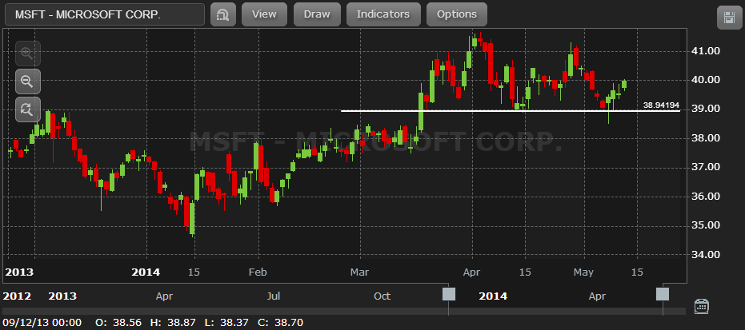
The horizontal line tool of Zignals free stock charts can be used to mark support and/or resistance
-
Vertical Line
Similar to a horizontal line, except it marks a point in time. A left click on the line will display the move icon. Left-click-and-drag to reposition the line.
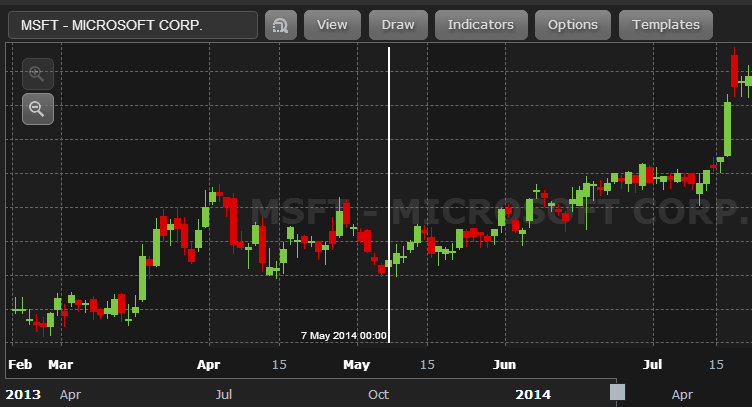
The vertical line of Zignals free stock and free forex charts can be used to mark time pivot swings
-
Ellipse
Adds a circle on the chart, perhaps to highlight peaks and troughs in price action. The opacity tool within the Edit menu can be set so as not to obscure the underlying price action.
-
Rectangle and Rotation Rectangle
The rectangle tool can be used to mark consolidation regions or thicker bands of support and resistance.
-
Text Note
Comments can be added directly to the chart. Each note has four pointer anchors; one on each side. These can be dragged into position. Font size, margin padding and border thickness can be adjusted. Text colour and border colours and opacity can be changed too.
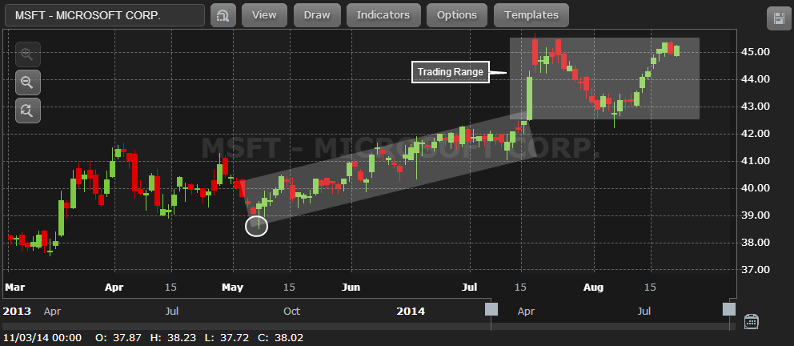
A Zignals stock chart using rectangle, rotation rectangle, ellipse and text note draw shapes
-
Fibonacci Retracements, Time Zones, Fan and Arcs
Set Fibonacci anchors to peaks and troughs. Right-click-edit to change colours, opacity and line thickness.
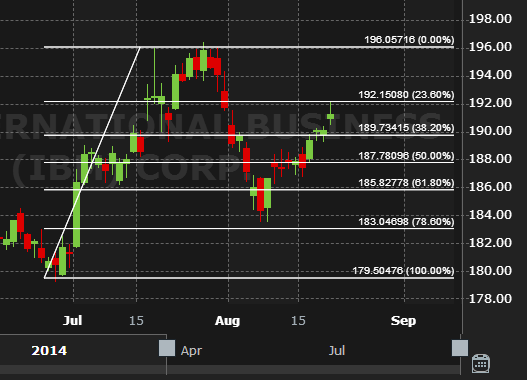
Zignals free stock and free forex charts offer Fibonacci Retracement, Fibonacci Time Zone,
Fibonacci Fan and Fibonacci Arcs
-
DiNapoli Levels
Set the three anchors so the mid-point is highest (for projecting price targets in a bullish trend) or lowest (for projecting price targets in a bearish trend). Adjust the zoom of the price axis with a left-click-and-drag up, to view outer range price targets.
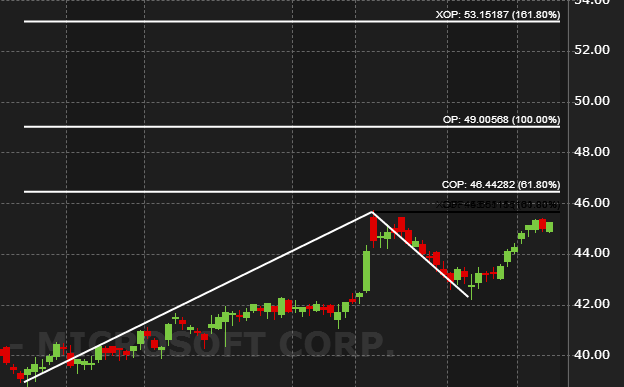
Zignals free stock and free forex charts offer DiNapoli Level projections
-
Gann Box and Fan
Used to define potential support/resistance and reversal areas. Use the opacity tool on right-click-edit to blend the gann box into the price chart.
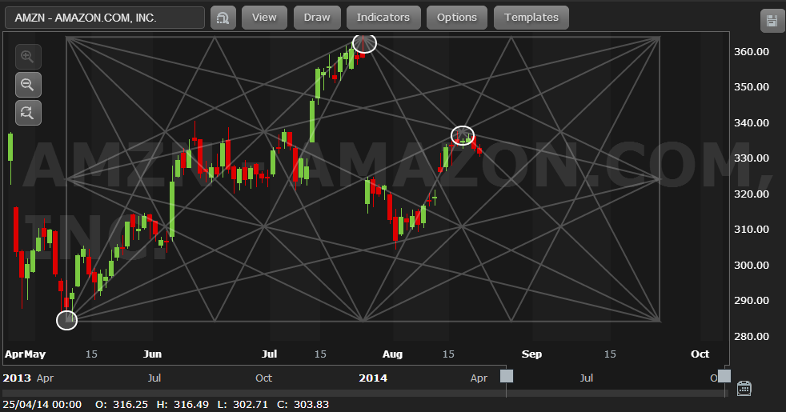
Zignals stock chart using a Gann box combined with Ellipse tool to mark reversals.
Future inflection points marked by convergence in box lines.
-
Andrews's Pitchforks
Andrew's pitchforks are configured so that the mid-line of Pitchfork is anchored at the base of the trend, with the two outer forks aligning along the projected channel.
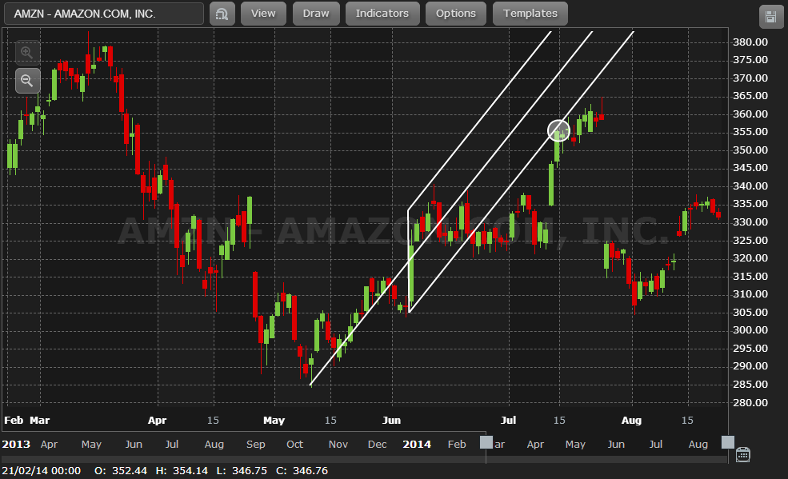
Zignals free stock and free forex charts offer Andrew's Pitchforks which can be used to define price channels.
-
Indicators
The indicator menu provides a list of available price overlays and lower panel technical indicators. Individual indicator settings can be edited by clicking on the relevant indicator in the Indicator bar.
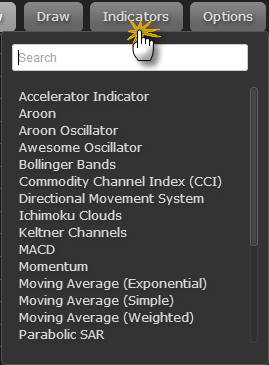
Zignals free stock and free forex charts offer
30 technical indicators, including Ichimoku Clouds
and our redesigned support/resistance tool.
-
Options
Select from line (O,H,L,C), Candlestick, Bar, Kagi, Heikin Ashi and Mountain charts. Also can toggle the crosshair and price information box control.
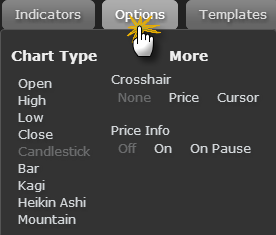
Zignals free stock and free forex charts offer
line, candlestick, OHLC bar, Kagi and
Heikin Ashi charts.
-
Template
Once you have a selected your preferred indicators and colour settings, you can save it as a Template for use again. Templates can either be saved, or one selected from the list and then applied to your chart.
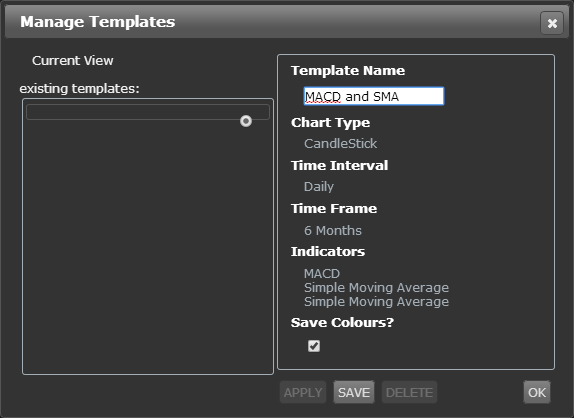
Zignals free stock and free forex charts include templates which store
both indicator and chart colour settings.
-
Settings Menu
On a right-click menu of chart is a Settings option. Settings allows you to configure the individual looks of your chart to include background colours, along with axis and price bars.
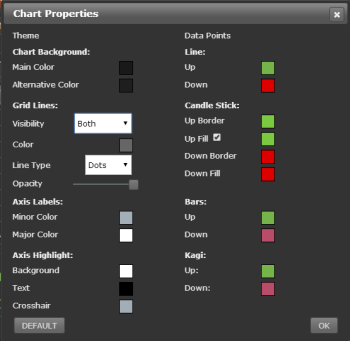
Zignals free stock and free forex charts offer chart colour
settings for background, price bars and axis,
including time axis.
-
Chart Save
Charts are saved to the hard-drive. To initiate a save, click save to bring up a snapshot of your chart, including any draw items, indicators or notes added. Then right-click inside the chart area to bring up the browser dialog for saving. Save the chart as an image to your computer. This image can then be tweeted.
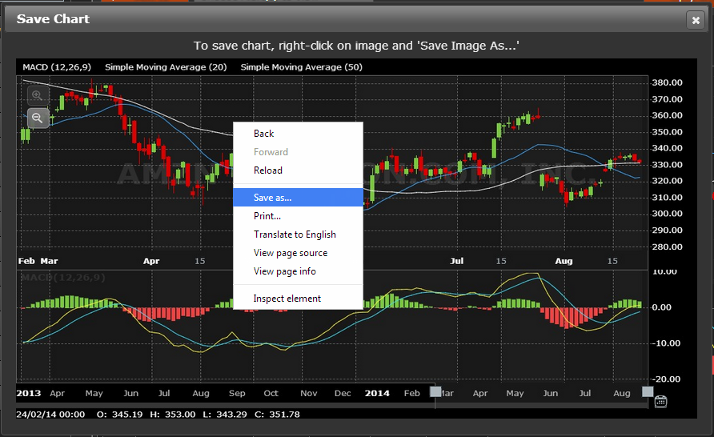
Zignals free stock and free forex charts saves a chart to the hard drive.
-
Adding 'Future' Time to a Stock or Forex Chart
If you wish to make space to the right of the chart, click on the chart area and drag left. This will add space to the right of your chart.