

HTML5 Charts and Alerts
Zignals is the global leader in stock alerts (No. 1 on Google), but we aren't resting on our laurels. New look Zignals now offers comprehensive charting tools with fast alerting - all in a mobile-friendly design.
Powerful Market Alerts
With Zignals you can select from 50+ different types of alerts: covering price, volume and technical triggers. Simple one-click setup will keep you one step ahead of the market.
In-App, SMS & Email Delivery
Zignals offers multiple ways to receive your alerts. In-app notifications keep you informed as you watch the market. While SMS and Email delivery alerts you while you are away.
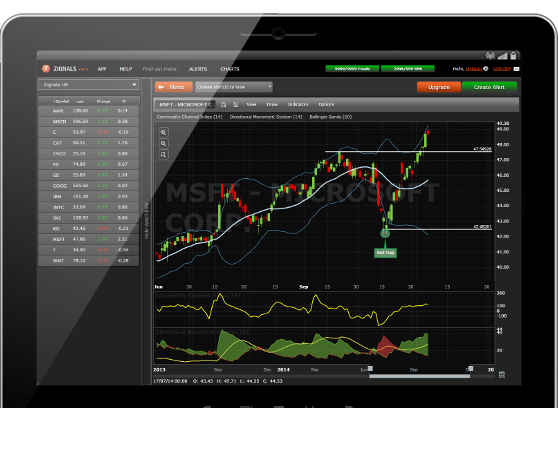
View Alert Winners
Track alert performance on a chart or in tabulated form. Triggers can be viewed independently or in combination, showing potential gain (or loss!).
Try Zignals' Alerts for Free
We offer a range of competitive monthly, quarterly and annual packages, but you can start building alerts on some of the leading equities in the market right now - for free.
Custom Watchlists
Pro Users can build custom watchlists. Watchlists support group alerts and quick view charting. Prices start at $10 a month.